Most hiring advice in education technology is anecdotal. We wanted to publish something firmer, so we analyzed every open role currently live on EdTechJobs.io: 4,119 active listings across 367 companies hiring in K-12, Higher Ed, and corporate learning.
What follows is a snapshot of who is hiring, what they are paying, and how much candidate competition each type of role actually attracts.
A note on method: this reflects the roles on EdTechJobs.io, not a census of the entire industry. Where we cite pay, we use only salaries employers published themselves and not from estimates.
The market at a glance
The EdTech hiring market in mid-2026 is broad but concentrated. Nearly 400 organizations are actively hiring, and the split across segments is more balanced than most people assume:
- K-12: 1,758 open roles (42.7%)
- Higher Ed: 1,341 open roles (32.6%)
- Corporate learning: 1,020 open roles (24.8%)
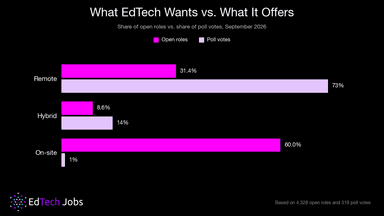
The bigger surprise is location. Despite EdTech's reputation as a remote-friendly sector, the majority of open roles are on-site:
- On-site: 2,538 roles (65.1%)
- Remote: 1,256 roles (32.2%)
- Hybrid: 104 roles (2.7%)
That on-site share is driven largely by K-12 and campus-based organizations. Learning centers, districts, and schools hire in physical locations by nature. If you are a remote-first software company competing for the same talent, you have a genuine differentiator worth advertising.
Correction, August 4, 2026. This section first reported 1,055 remote roles (25.6%) against 2,956 on-site (71.8%). Reviewing how we classify work arrangement, we found that listings whose source data gave only a country, with no city, were being recorded as on-site by default. A posting that says nothing more than "United States" is not evidence of on-site work, and treating it that way undercounted remote roles. The figures above reflect the corrected classification, checked against employer applicant tracking systems wherever those publish an explicit remote flag, and are drawn from the 3,898 roles whose arrangement we can state with confidence. The direction of the finding holds: on-site is still roughly two thirds of EdTech hiring, and remote is still the minority. The size of the gap is materially different, though. Remote is closer to a third of this market than to the quarter we first reported.
Correction, September 19, 2026. This report said hybrid roles were 2.7% of EdTech hiring. That understated them. Our system recognized a hybrid role only when the word "hybrid" appeared in its location or title, and it missed roles that described a hybrid schedule in the job description, such as "three days a week in our Boston office." After fixing this, hybrid is 8.6% of classified roles and on-site is 60.0%. The finding that on-site is the majority of EdTech hiring still holds. Details are in our follow-up post on remote and on-site work.
What EdTech is actually hiring for
Engineering roles get the attention, but they are not the largest category. Operations and sales lead by volume:
- Operations: 901 roles
- Sales: 660 roles
- Engineering: 562 roles
- Teaching & instruction: 344 roles
- Marketing: 231 roles
- Customer Success: 209 roles
- Instructional Design: 207 roles
- Product: 185 roles
The takeaway for employers: EdTech is a commercial hiring market as much as a technical one. Sales, customer success, and marketing together account for more than 1,100 open roles, roughly double engineering.
Salary benchmarks by function
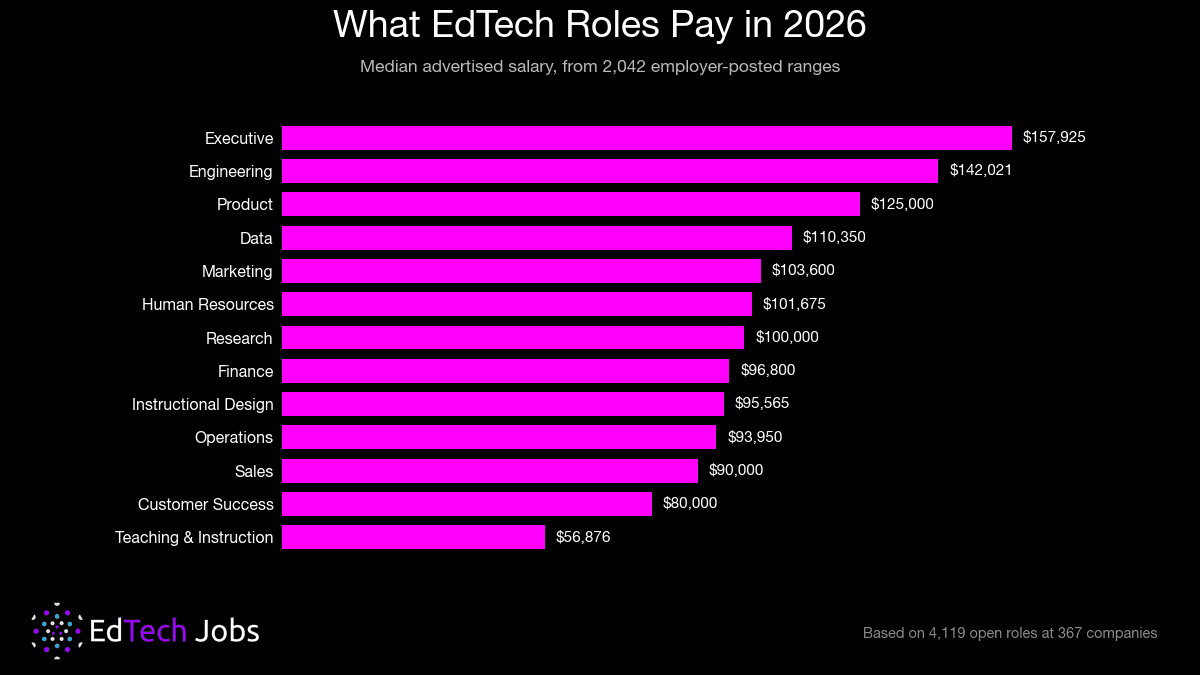
These are median midpoints from roles where the employer published a salary range (US, annual). Functions with fewer than 25 published ranges are excluded.
| Function | Median salary | Roles sampled |
|---|---|---|
| Executive | $157,925 | 54 |
| Engineering | $142,021 | 182 |
| Product | $125,000 | 83 |
| Data | $110,350 | 53 |
| Marketing | $103,600 | 79 |
| Human Resources | $101,675 | 42 |
| Research | $100,000 | 34 |
| Finance | $96,800 | 45 |
| Instructional Design | $95,565 | 58 |
| Operations | $93,950 | 246 |
| Sales | $90,000 | 203 |
| Customer Success | $80,000 | 67 |
| Teaching & instruction | $56,876 | 49 |
Instructional design sits at $95,565. That is higher than many assume, close to operations and above sales. It is a specialized skill set, and the market prices it that way.
One caveat on sales roles. Sales compensation is published inconsistently, so treat that $90,000 figure as the least reliable number in the table. Some employers post base salary only, some post base plus commission, and some post on-target earnings. Of the sales listings in this sample, 41% referenced variable pay somewhere in the range, whether commission, bonus, or OTE, while only a quarter explicitly labelled the figure as base. Total earnings for a sales role that hits target will often sit well above the median shown here.
These medians are a snapshot taken in July 2026. Our EdTech Salary Guide runs the same calculation against live listings and refreshes hourly, and it goes a level deeper than this table: 25th and 75th percentile ranges for each function, so you can see the spread rather than just the midpoint, plus breakdowns by seniority.
Half of EdTech employers still do not post salary
Of the 4,119 open roles we analyzed, 2,042 (just under half) included an employer-published salary range. The rest either omitted pay entirely or left candidates guessing.
This is the single easiest competitive advantage available in EdTech hiring right now. Pay transparency is also becoming law. Virginia and Maine both saw pay transparency laws take effect in July 2026, joining roughly twenty-five other state and local jurisdictions that already require pay disclosure in job postings. Virginia's applies to employers of every size. In a market where half your competitors are silent, publishing a range makes your listing immediately more credible, and it puts you ahead of a requirement that keeps spreading.
Which roles are hardest to fill (this surprised us)
Because we track apply-clicks on every listing, we can measure how much candidate interest a single opening actually attracts. Here is the average candidate interest per open role over the last 90 days.
| Function | Candidate interest per opening |
|---|---|
| Customer Success | 34.1 |
| Instructional Design | 32.2 |
| Product | 26.1 |
| Sales | 21.9 |
| Executive | 21.9 |
| Marketing | 21.6 |
| Data | 20.4 |
| Human Resources | 20.2 |
| Operations | 18.6 |
| Support | 18.0 |
| Research | 17.5 |
| Finance | 17.1 |
| Teaching & instruction | 15.1 |
| Engineering | 13.3 |
Engineering attracts the least candidate interest per opening of any function, despite paying the second-highest salaries. Meanwhile customer success and instructional design draw roughly two and a half times more interest per role.
This inverts the usual assumption. If you are hiring engineers in EdTech, you are competing in the tightest part of the market, and salary alone is not solving it. Those roles already pay $142K at the median. Visibility, employer brand, and mission clarity carry more weight than another few thousand dollars.
If you are hiring instructional designers or customer success managers, you have the opposite problem: you will not struggle for volume, you will struggle to identify the right candidate inside a large applicant pool. Clear, specific, well-scoped listings do more for you than wide distribution.
What this means if you are hiring in EdTech
Four practical takeaways from the data:
- Publish your salary range. Half of your competitors do not. It is the cheapest credibility you can buy, and candidates increasingly filter without it.
- Match your strategy to your role's competition level. Engineering and finance roles need reach and employer brand. Instructional design and customer success roles need precision and clear scoping.
- Advertise remote if you offer it. Roughly a third of EdTech roles are remote, so it is still the minority in a mostly on-site market. If yours is remote, that is a real differentiator worth stating plainly in the listing.
- Keep your listings complete and current. Partial or stale role lists cost you candidates who never learn the opening exists.
That last point is worth dwelling on. In reviewing employer accounts, the most common gap we see is not a bad job description. It is an incomplete picture. Companies with dozens of open roles frequently have only a fraction visible to candidates, because listings were posted once and never refreshed.
About this data
All figures reflect active listings on EdTechJobs.io as of July 31, 2026: 4,119 open roles across 367 hiring organizations. Salary figures use only employer-published ranges (US, annual), never derived estimates. Candidate interest reflects apply-clicks over the trailing 90 days, normalized per open role. The work-arrangement breakdown was recalculated on August 4, 2026 after we corrected how country-only locations are classified, and is noted inline above. For figures that stay current after this report ages, use the EdTech Salary Guide, which applies the same methodology to live listings every hour.
We publish this report periodically. If there is a cut of the data that would be useful to your hiring team, tell us and we will look at including it next time.
If you are hiring and want your full set of open roles kept current on EdTechJobs.io, with a verified company profile and hiring analytics for each listing, Employer Plus is built for that.
- Work with Purpose 💜